

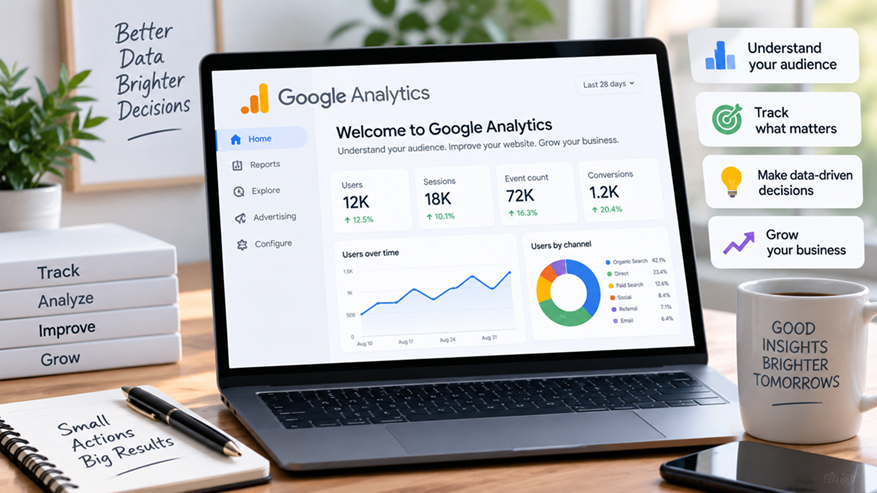
Understanding how visitors find and use your website is essential for making smarter digital marketing decisions. Google Analytics 4 (GA4) gives website owners, marketers, and content creators a structured way to measure traffic, engagement, conversions, and user journeys.
Unlike older versions of Google Analytics, GA4 is built around an event-based measurement model, meaning interactions such as page views, clicks, video plays, and purchases can be measured as events.
This beginner’s guide explains how Google Analytics works, what its most important metrics mean, and how you can use the data to improve a website.
What Is Google Analytics?
Google Analytics is a web and app analytics platform that collects information about how people interact with digital properties and turns that information into reports.
For example, it can help you answer questions such as:
- How many people visited my website?
- Where did my visitors come from?
- Which pages received the most engagement?
- What actions did visitors take?
- Which marketing channels generated conversions?
- Are visitors using mobile or desktop devices?
GA4 can measure websites and apps through data streams, allowing businesses to analyze user interactions across digital platforms.
For additional background, see Google Analytics 4: Four Things You Need to Know from Forbes.
How Does Google Analytics 4 Work?
GA4 collects interactions as events. An event could represent almost any meaningful action, such as:
- Viewing a page
- Clicking a button
- Starting a video
- Downloading a file
- Submitting a form
- Completing a purchase
Some events are collected automatically, while others may need additional configuration.
This event-based approach gives marketers greater flexibility when analyzing individual user interactions rather than relying primarily on traditional session-based reporting.
How to Set Up Google Analytics
1. Create a Google Analytics Property
Start by creating a Google Analytics account and property. During setup, choose the appropriate reporting time zone and currency for your business.
2. Add a Data Stream
For a website, create a Web data stream. Google provides a measurement ID that connects your website with the GA4 property.
3. Install the Google Tag
Add the Google tag to your website through your CAMS, website builder, or manually through your site’s code. Google also provides instructions for platforms such as WordPress, Shoplift, and Wiz.
4. Verify Data Collection
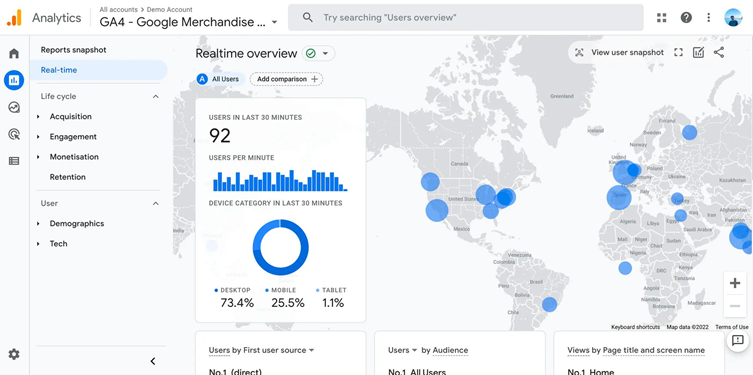
After installation, use GA4’s Real time reporting to confirm that activity is being received. Testing the setup before relying on reports is an important practical step because incorrectly implemented tracking can produce misleading data.
You can also experiment with Google’s GA4 demo account without affecting your own property’s data.
Important Google Analytics Metrics for Beginners
Users
Users represent people interacting with your website or app. Comparing user trends over time can help you understand whether your audience is growing.
Sessions
A session represents a period of user activity. Sessions can help you understand the volume of visits your website receives.
Views
Views measure content viewed by users, including pages or screens.
Engagement Rate
Engagement rate helps indicate how frequently visits meet GA4’s criteria for an engaged session. It can provide more useful context than looking at traffic volume alone.
Events
Events describe individual interactions, such as clicks, downloads, searches, or purchases.
Conversions
Conversions represent important business outcomes. Depending on the website, this could be a purchase, lead submission, registration, or another valuable action.
Understanding Google Analytics Reports
GA4 organizes information into areas such as Acquisition, Engagement, Monetization, and Retention. The reporting interface also includes Explorations and advertising-related tools.
Acquisition Reports
Acquisition reports help you understand where visitors originate.
For example, you might discover that:
- Organic search generates many visitors.
- Email generates fewer visitors but more leads.
- Social media produces high engagement.
- Paid advertising produces valuable purchases.
This distinction is important because the channel generating the most traffic is not necessarily the channel generating the most business value.
Engagement Reports
Engagement reporting helps you understand what visitors do after arriving.
Suppose a blog receives 10,000 monthly visitors, but its key product page receives very little engagement. That information could encourage you to improve internal links, calls to action, page design, or content relevance.
Monetization Reports
For commence websites, monetization reports can help analyze purchases, revenue, products, and other commercial activity.
A Simple Real-World Example
Imagine you run an online clothing store.
GA4 shows:
- 60% of visitors arrive through organic search.
- 20% arrive through paid advertising.
- 10% arrive through email.
- Email visitors have the highest purchase rate.
A beginner might conclude that SEO deserves all the attention because it generates the most traffic.
A better analysis asks which channel produces the best business outcome. If email generates significantly more purchases per visitor, you may decide to strengthen your email strategy while continuing to invest in organic search.
That is the real value of analytics: turning numbers into decisions.
Common Google Analytics Mistakes to Avoid
Tracking Everything Without a Purpose
More data is not automatically better. Define your business objectives first and measure the interactions that support them.
Ignoring Tracking Quality
Incorrect tags, duplicate tracking, or poorly configured events can distort reports. Validate important tracking before using the data to make decisions.
Focusing Only on Traffic
High visitor numbers can look impressive but do not necessarily mean better performance. Connect traffic metrics with engagement, leads, sales, or other meaningful outcomes.
Making Decisions From Short-Term Fluctuations
A single day’s performance rarely provides enough context. Compare appropriate time periods and consider seasonality, campaigns, and other external factors.
Best Practices for Beginners
Start with a small set of meaningful questions:
- Where are my visitors coming from?
- What content attracts them?
- What actions matter most?
- Which channels generate those actions?
- Where are users dropping out?
Google also provides free Analytics Academy courses covering setup, data collection, reporting, measurement features, and integration.
For another practical perspective, Getting Started With GA4 from Search Engine Journal provides beginner-focused guidance on traffic, engagement, events, and conversions.
Conclusion
Google Analytics can seem complicated when you first open it, but beginners do not need to understand every report or feature immediately. Start with the fundamentals: set up accurate tracking, understand your key metrics, identify important user actions, and connect analytics data to business objectives.
The goal is not simply to collect more numbers. It is to use reliable information to understand your audience, identify opportunities, improve your website, and make better-informed decisions.
